Plot Types
Six plot types of original ggplot2 are supported in ggplot2.sparkR now. More types will be updated.
Since the usage of ggplot2.sparkR is exactly the same with origin ggplot2.sparkR, we could click following links to reference them in the original ggplot2 documentation.
Geoms
Geoms, short for geometric objects, describe the type of plot you will produce.
Statistics
It’s often useful to transform your data before plotting, and that’s what statistical transformations do.
Scales
Coordinate Systems
Facets
Position Adjustment
Examples
The parameter data in examples can be either R data.frame or Spark DataFrame.
If the input data is Spark DataFrame, heavyweight data processing stages are offloaded to the Spark backend using the SparkR API.
1. geom_bar
Bars, rectangles with bases on x-axis
ggplot(data, aes(x = Item, fill = Payment)) + geom_bar()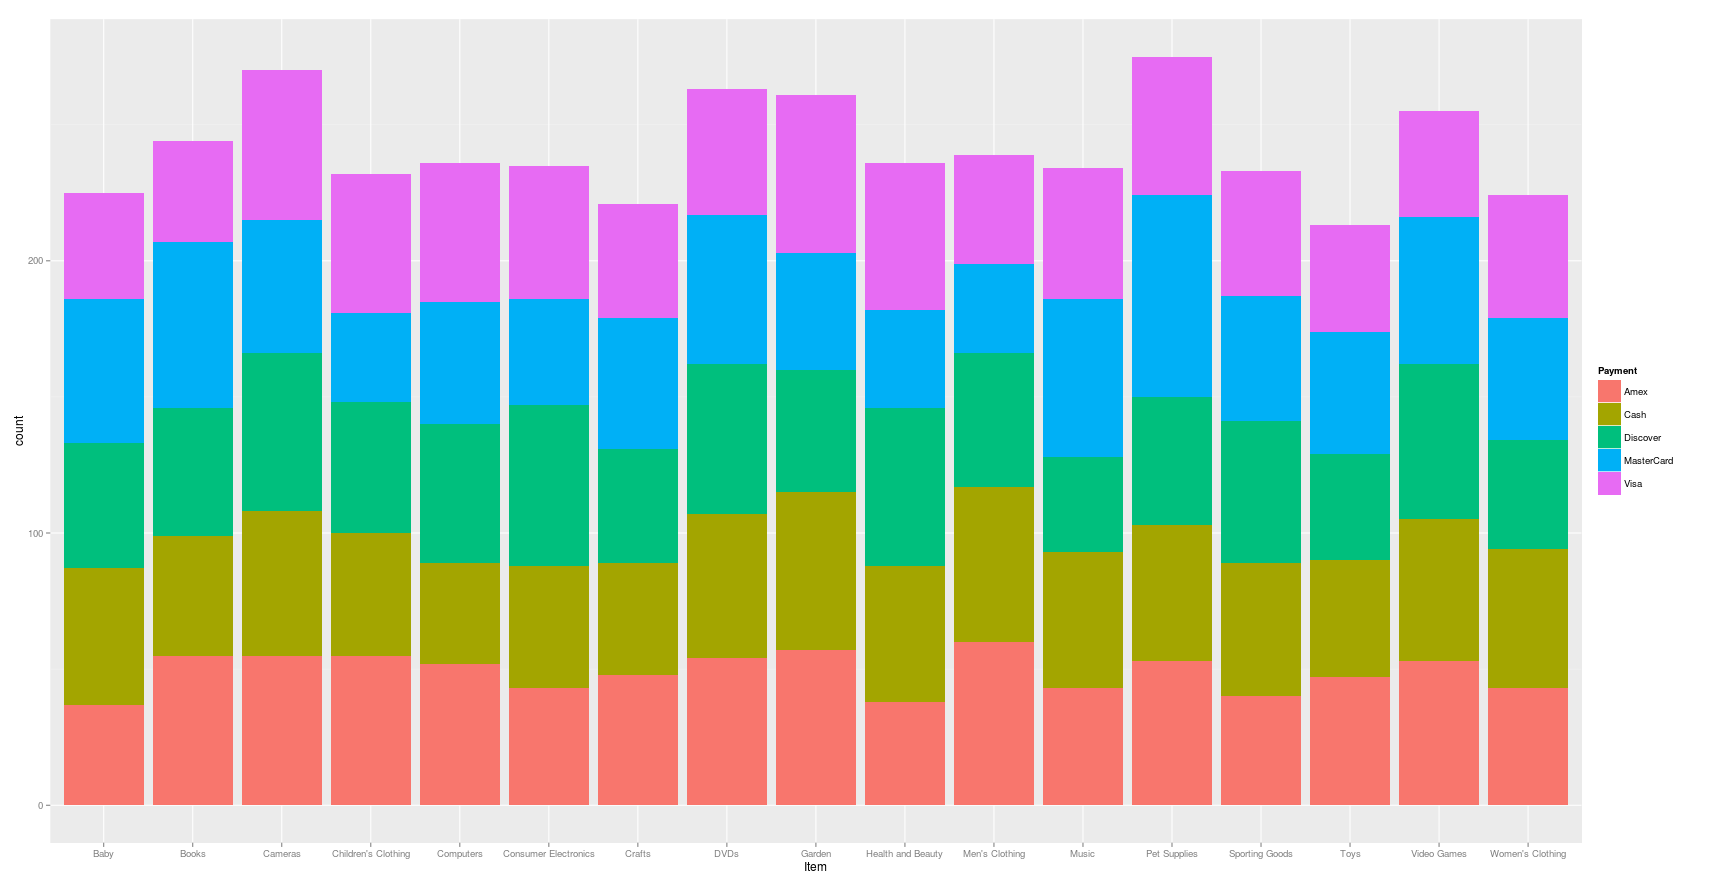
2. geom_histogram
Histogram. Bars, rectangles with bases on x-axis using continuous data.
ggplot(data, aes(x = Price)) + geom_histogram(binwidth = 10)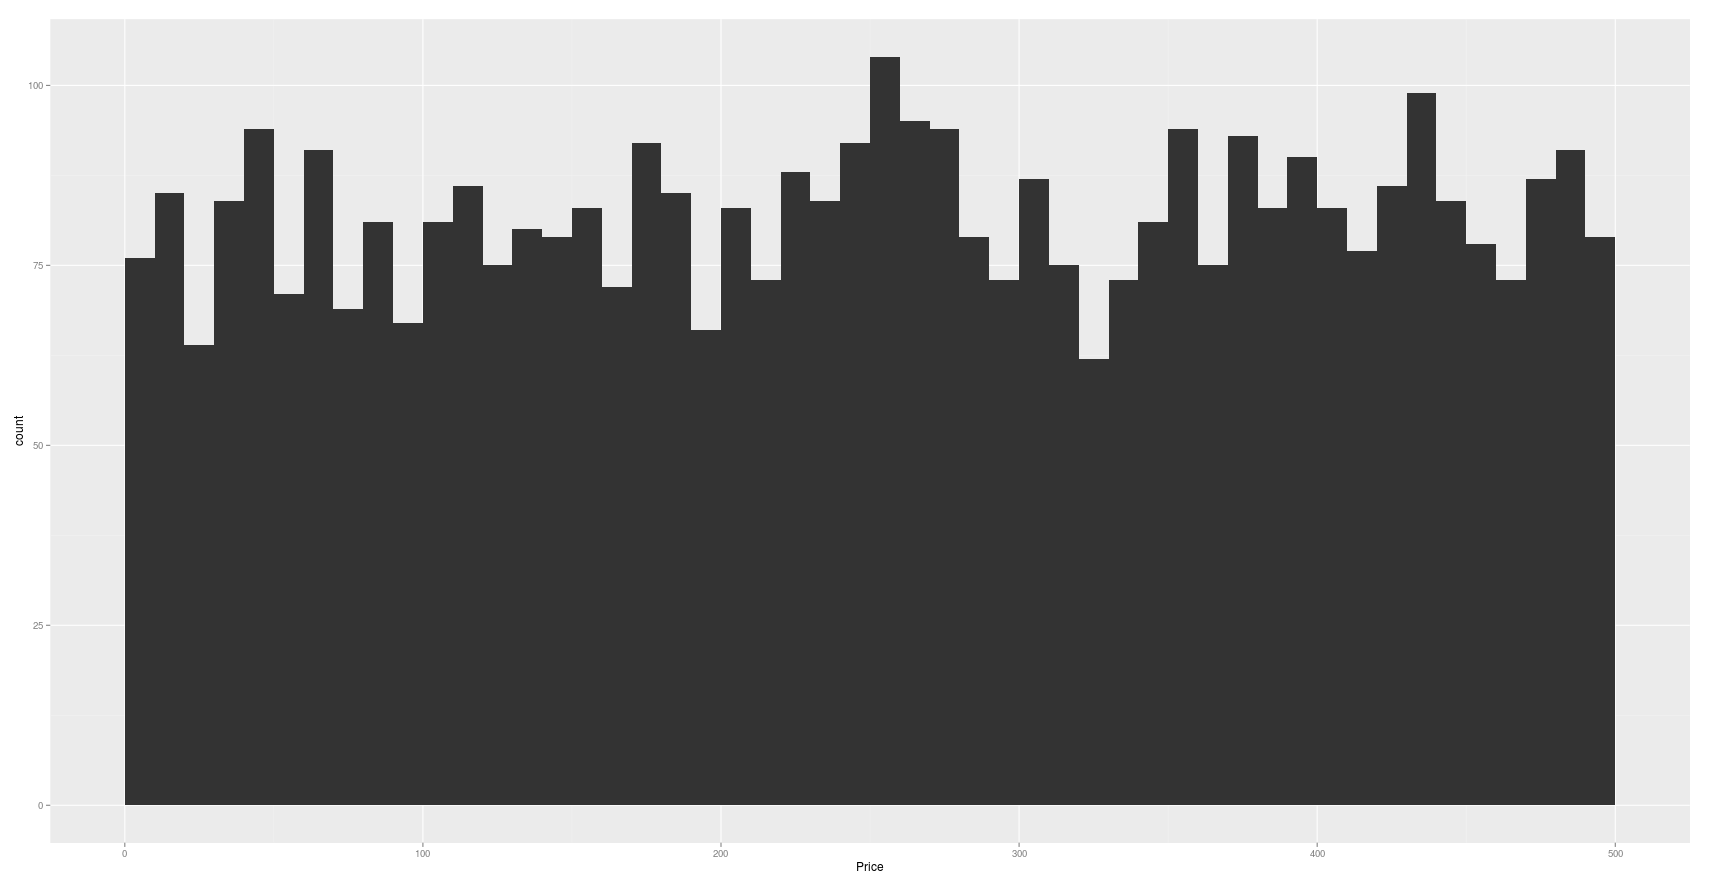
3. stat_sum
Sum unique values. Useful for overplotting on scatterplots.
ggplot(data, aes(x = Item, y = Payment)) + stat_sum()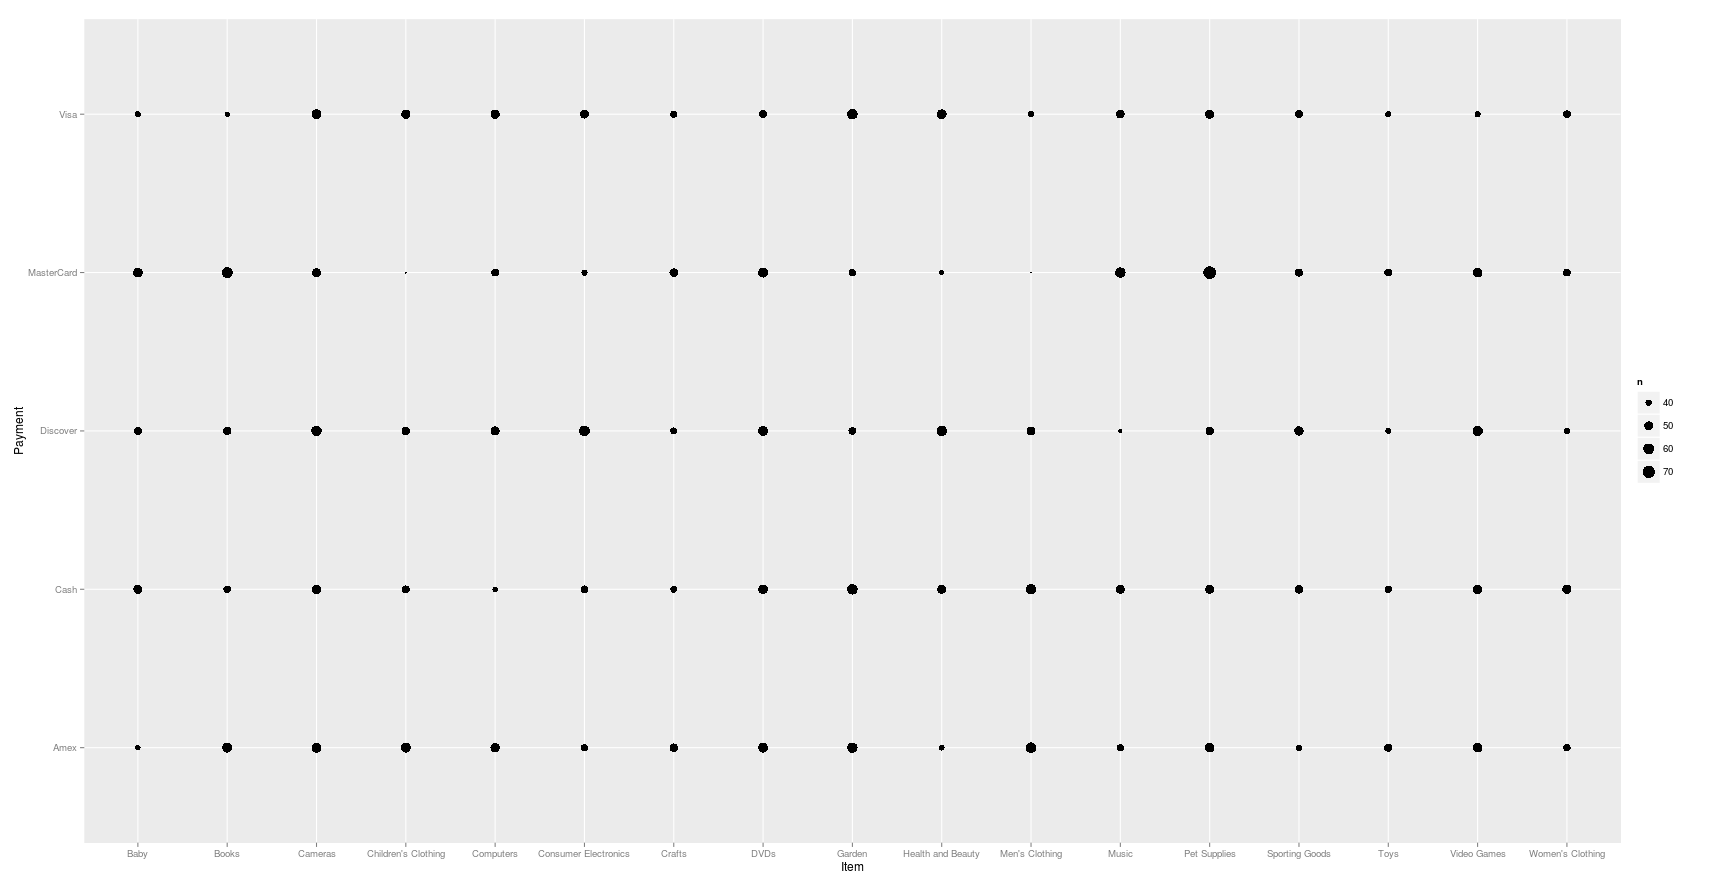
4. geom_bin2d
Add heatmap of 2d bin counts.
ggplot(data, aes(x = Item, y = Price)) + geom_bin2d()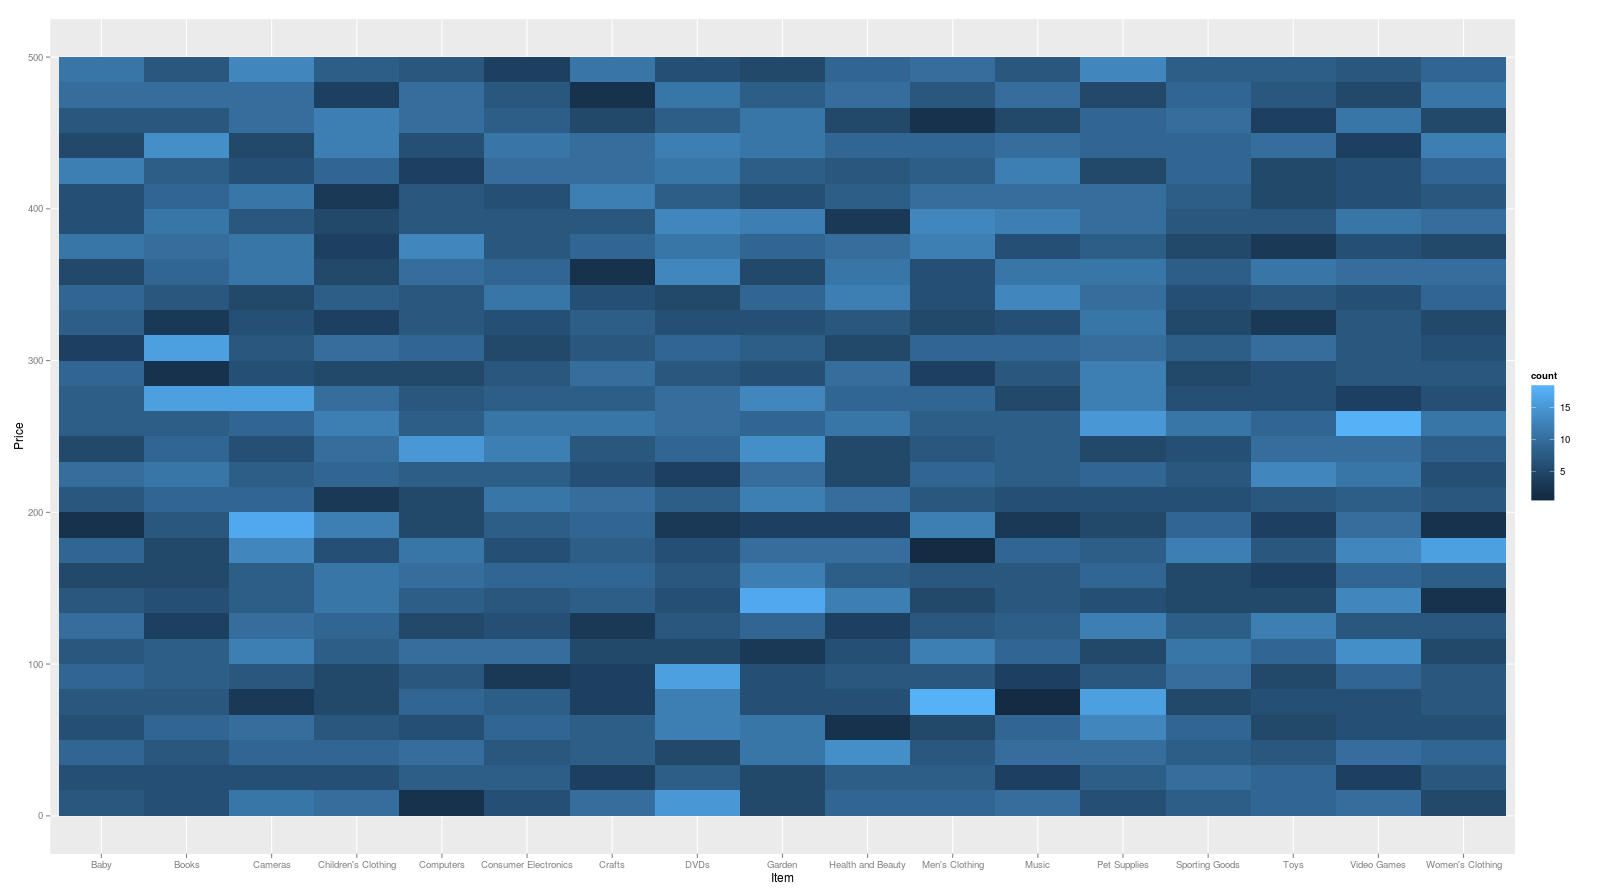
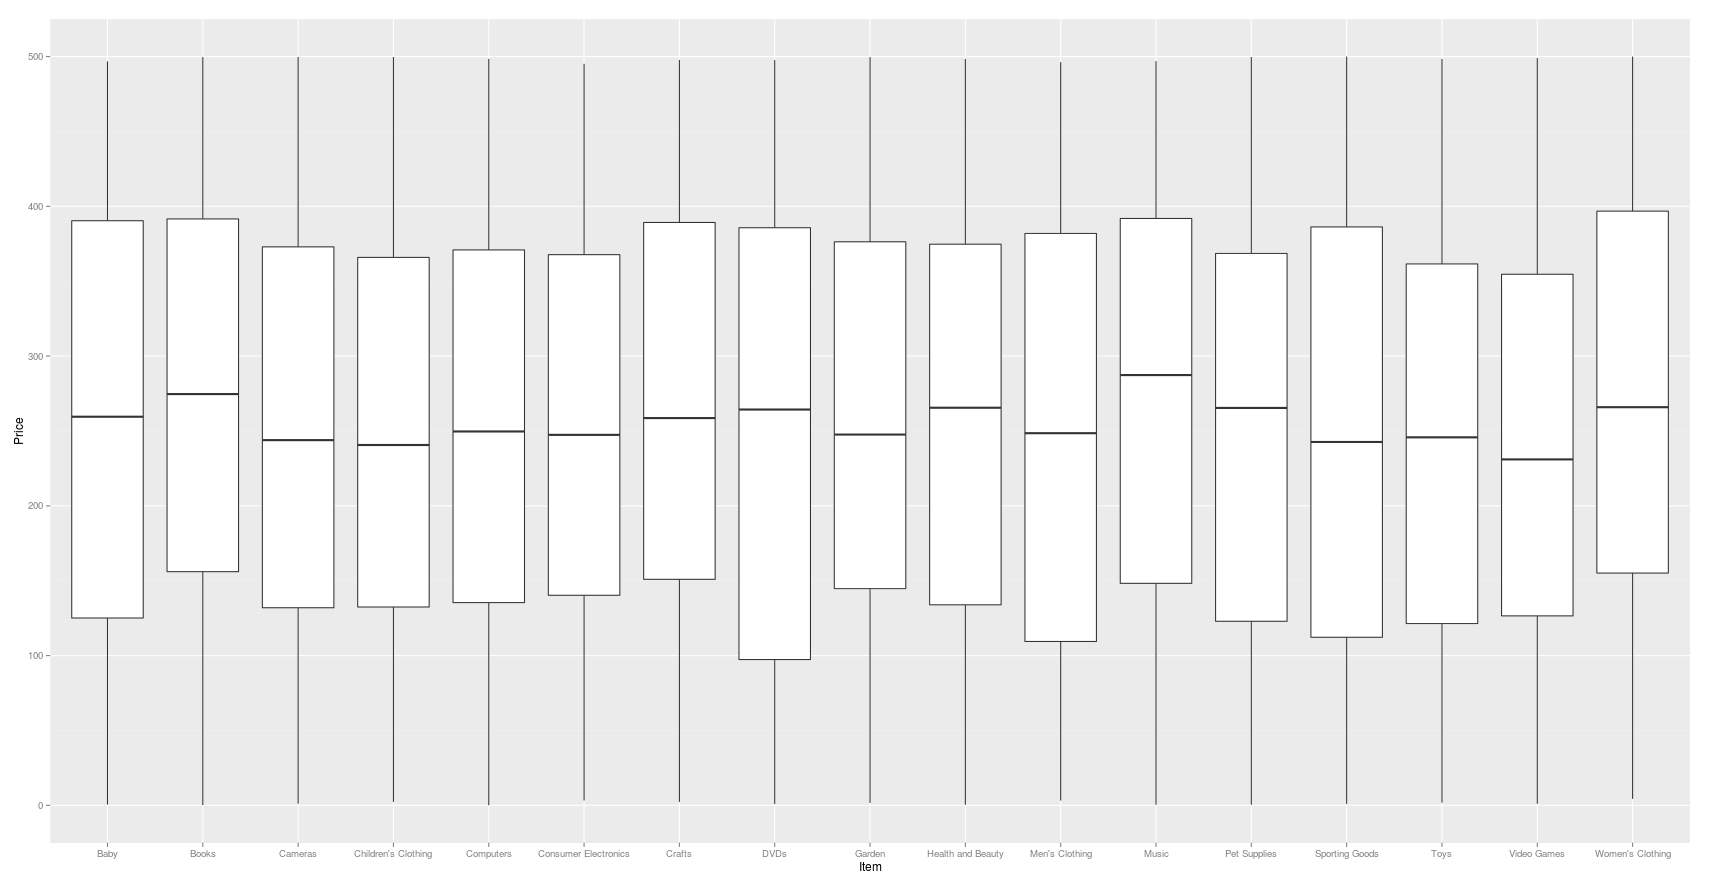
5. geom_boxplot
Calculate components of box and whisker plot.
ggplot(data, aes(x = Item, y = Price)) + geom_boxplot()